S&P 500 Index Price

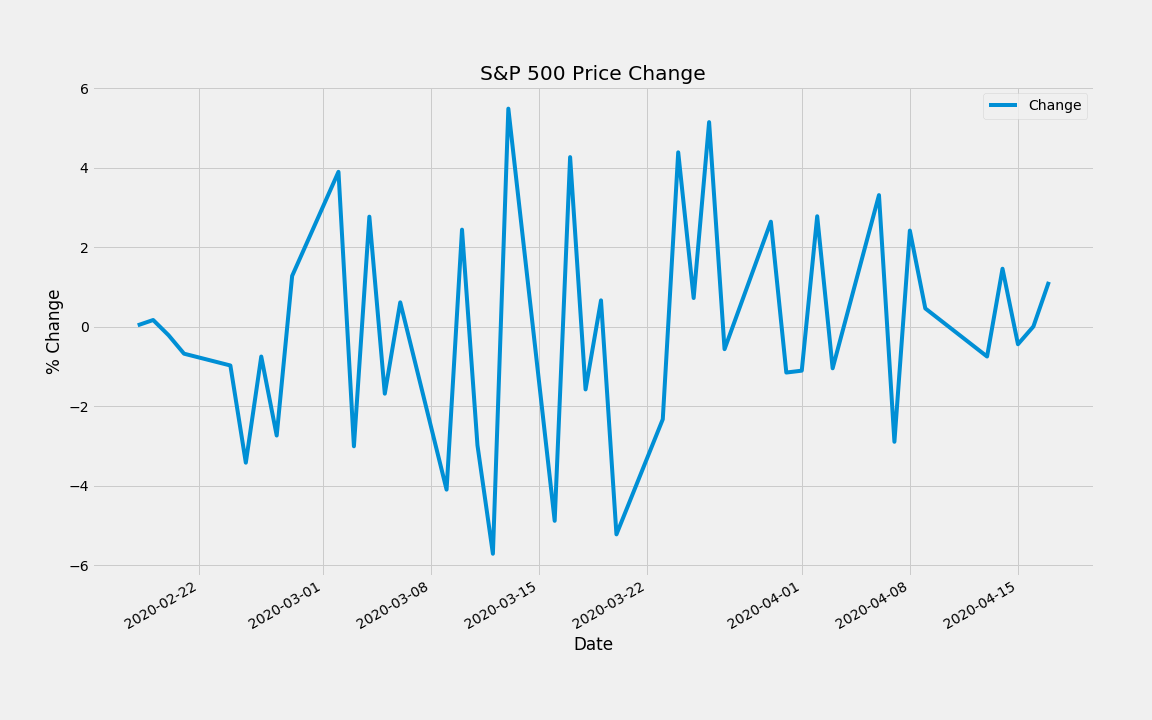
The S&P 500 is a good representation of the whole stock market, and as you can also see here there is a lot o change in the price of the underlying index. With the internet and with technology people have more access to news and tolls for trade never seen before. A good example is Robinhood where people can trade stocks, options, and even cryptocurrencies within seconds with no fees.
S&P Index Volume

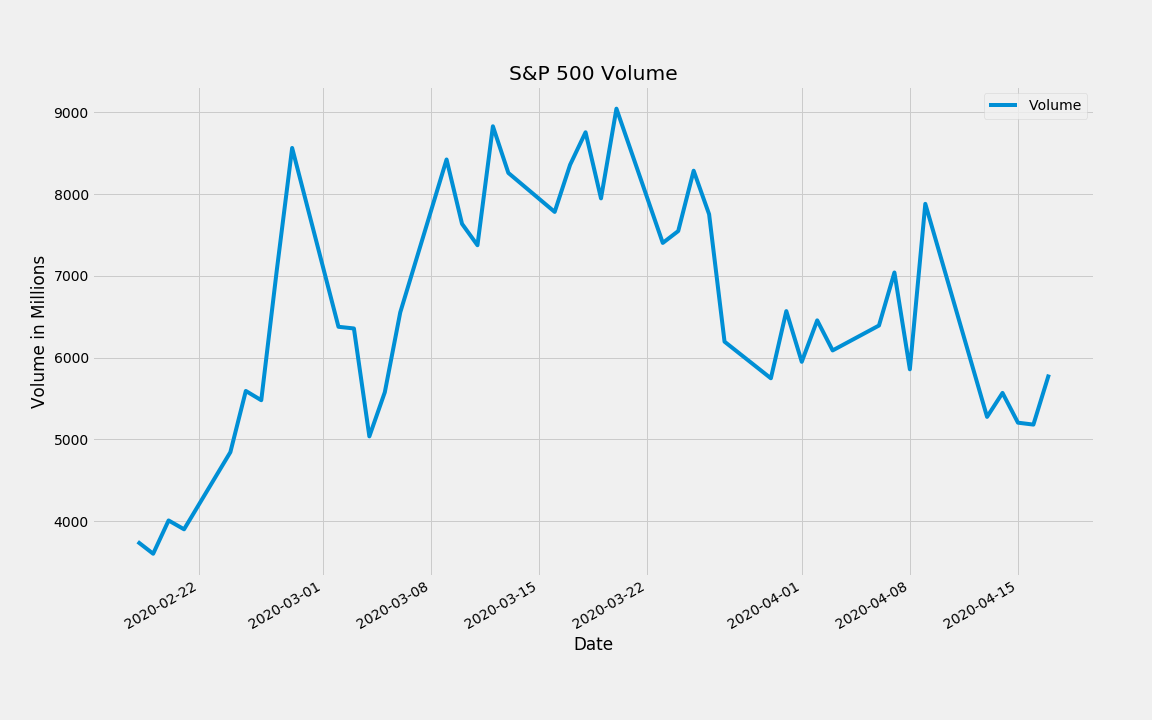
This graph perfectly represents how much volatility and speculation there is in the market. On average people hold a stock for much less time compared to 10 or 20 years ago. People want to get rich fast so they try to guess what the market is going to do, but the consequences are that they are exposed to big risk and the possibility of losing all of their money.
Oil Price

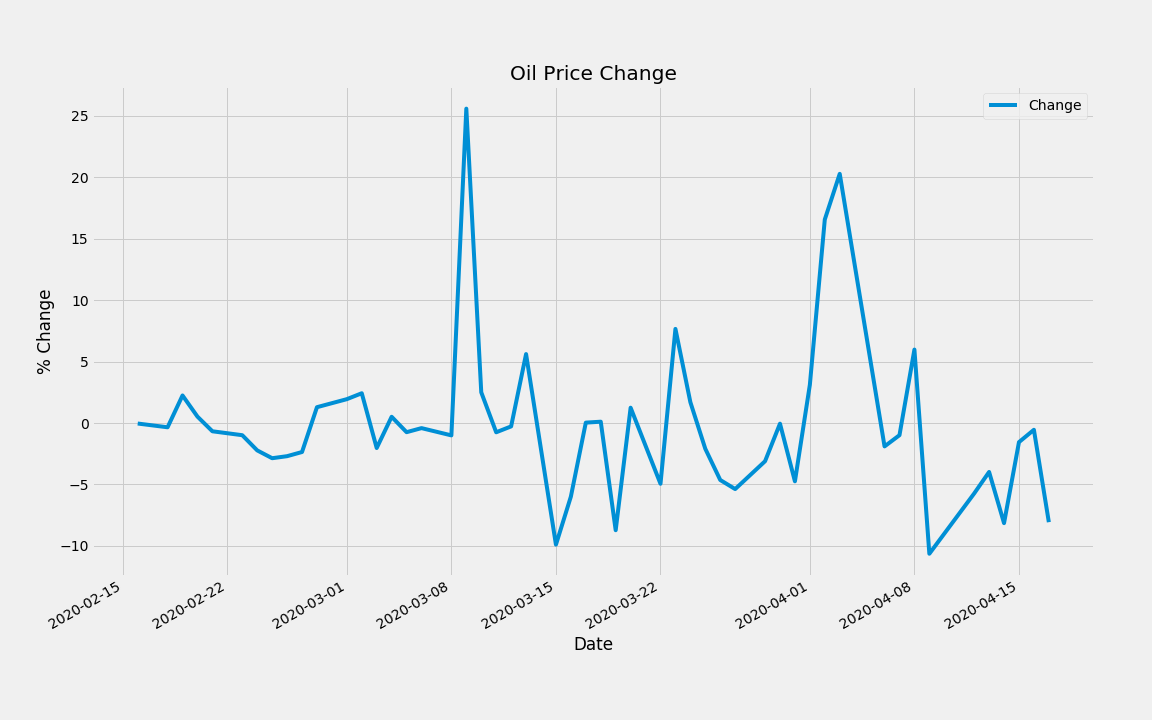
One of the sectors that I like to keep up with is oil. Russia and Saudia Arabia were violating OPEC rules, so I thought it was interesting how the price of oil moved throughout this conflict. By mid-April, all of the countries participating in the OPEC agreed to significantly reduce their oil production to increase the oil prices as demand decreased significantly. Even with that agreement, the oil price hit a historic low.